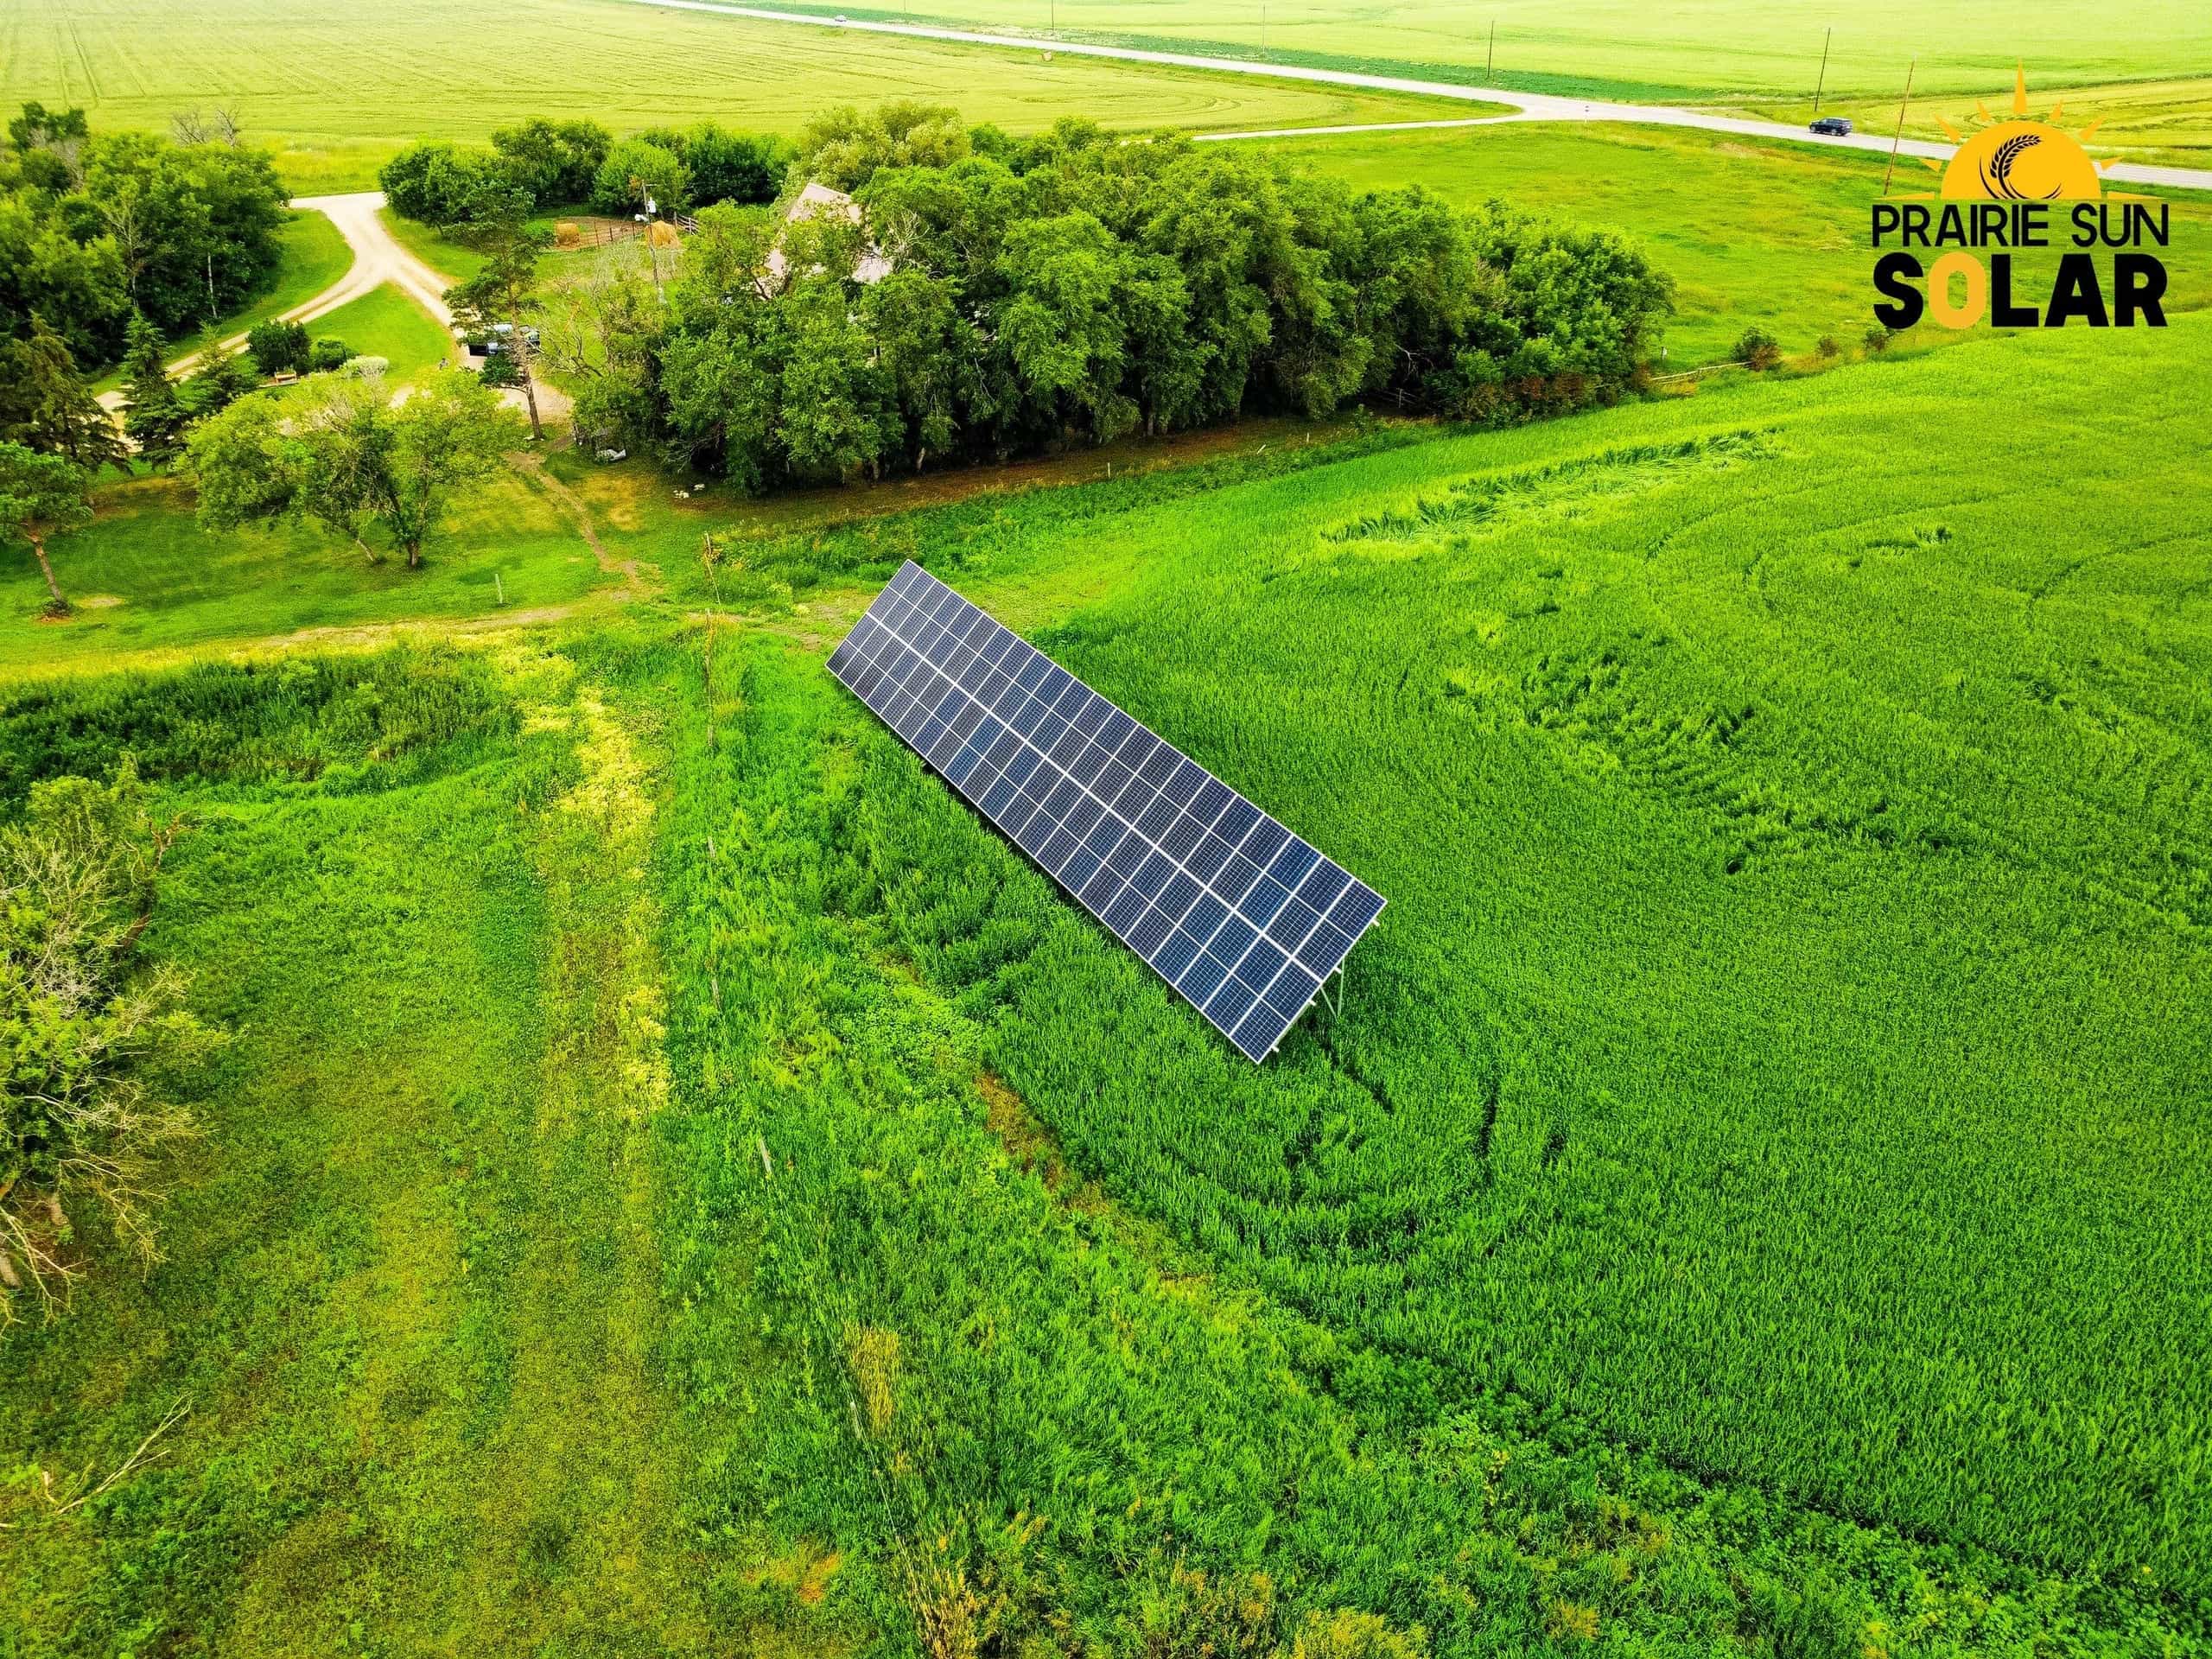
Audette Farm Solar Near Melfort — 23.5 kW Bifacial Ground Mount
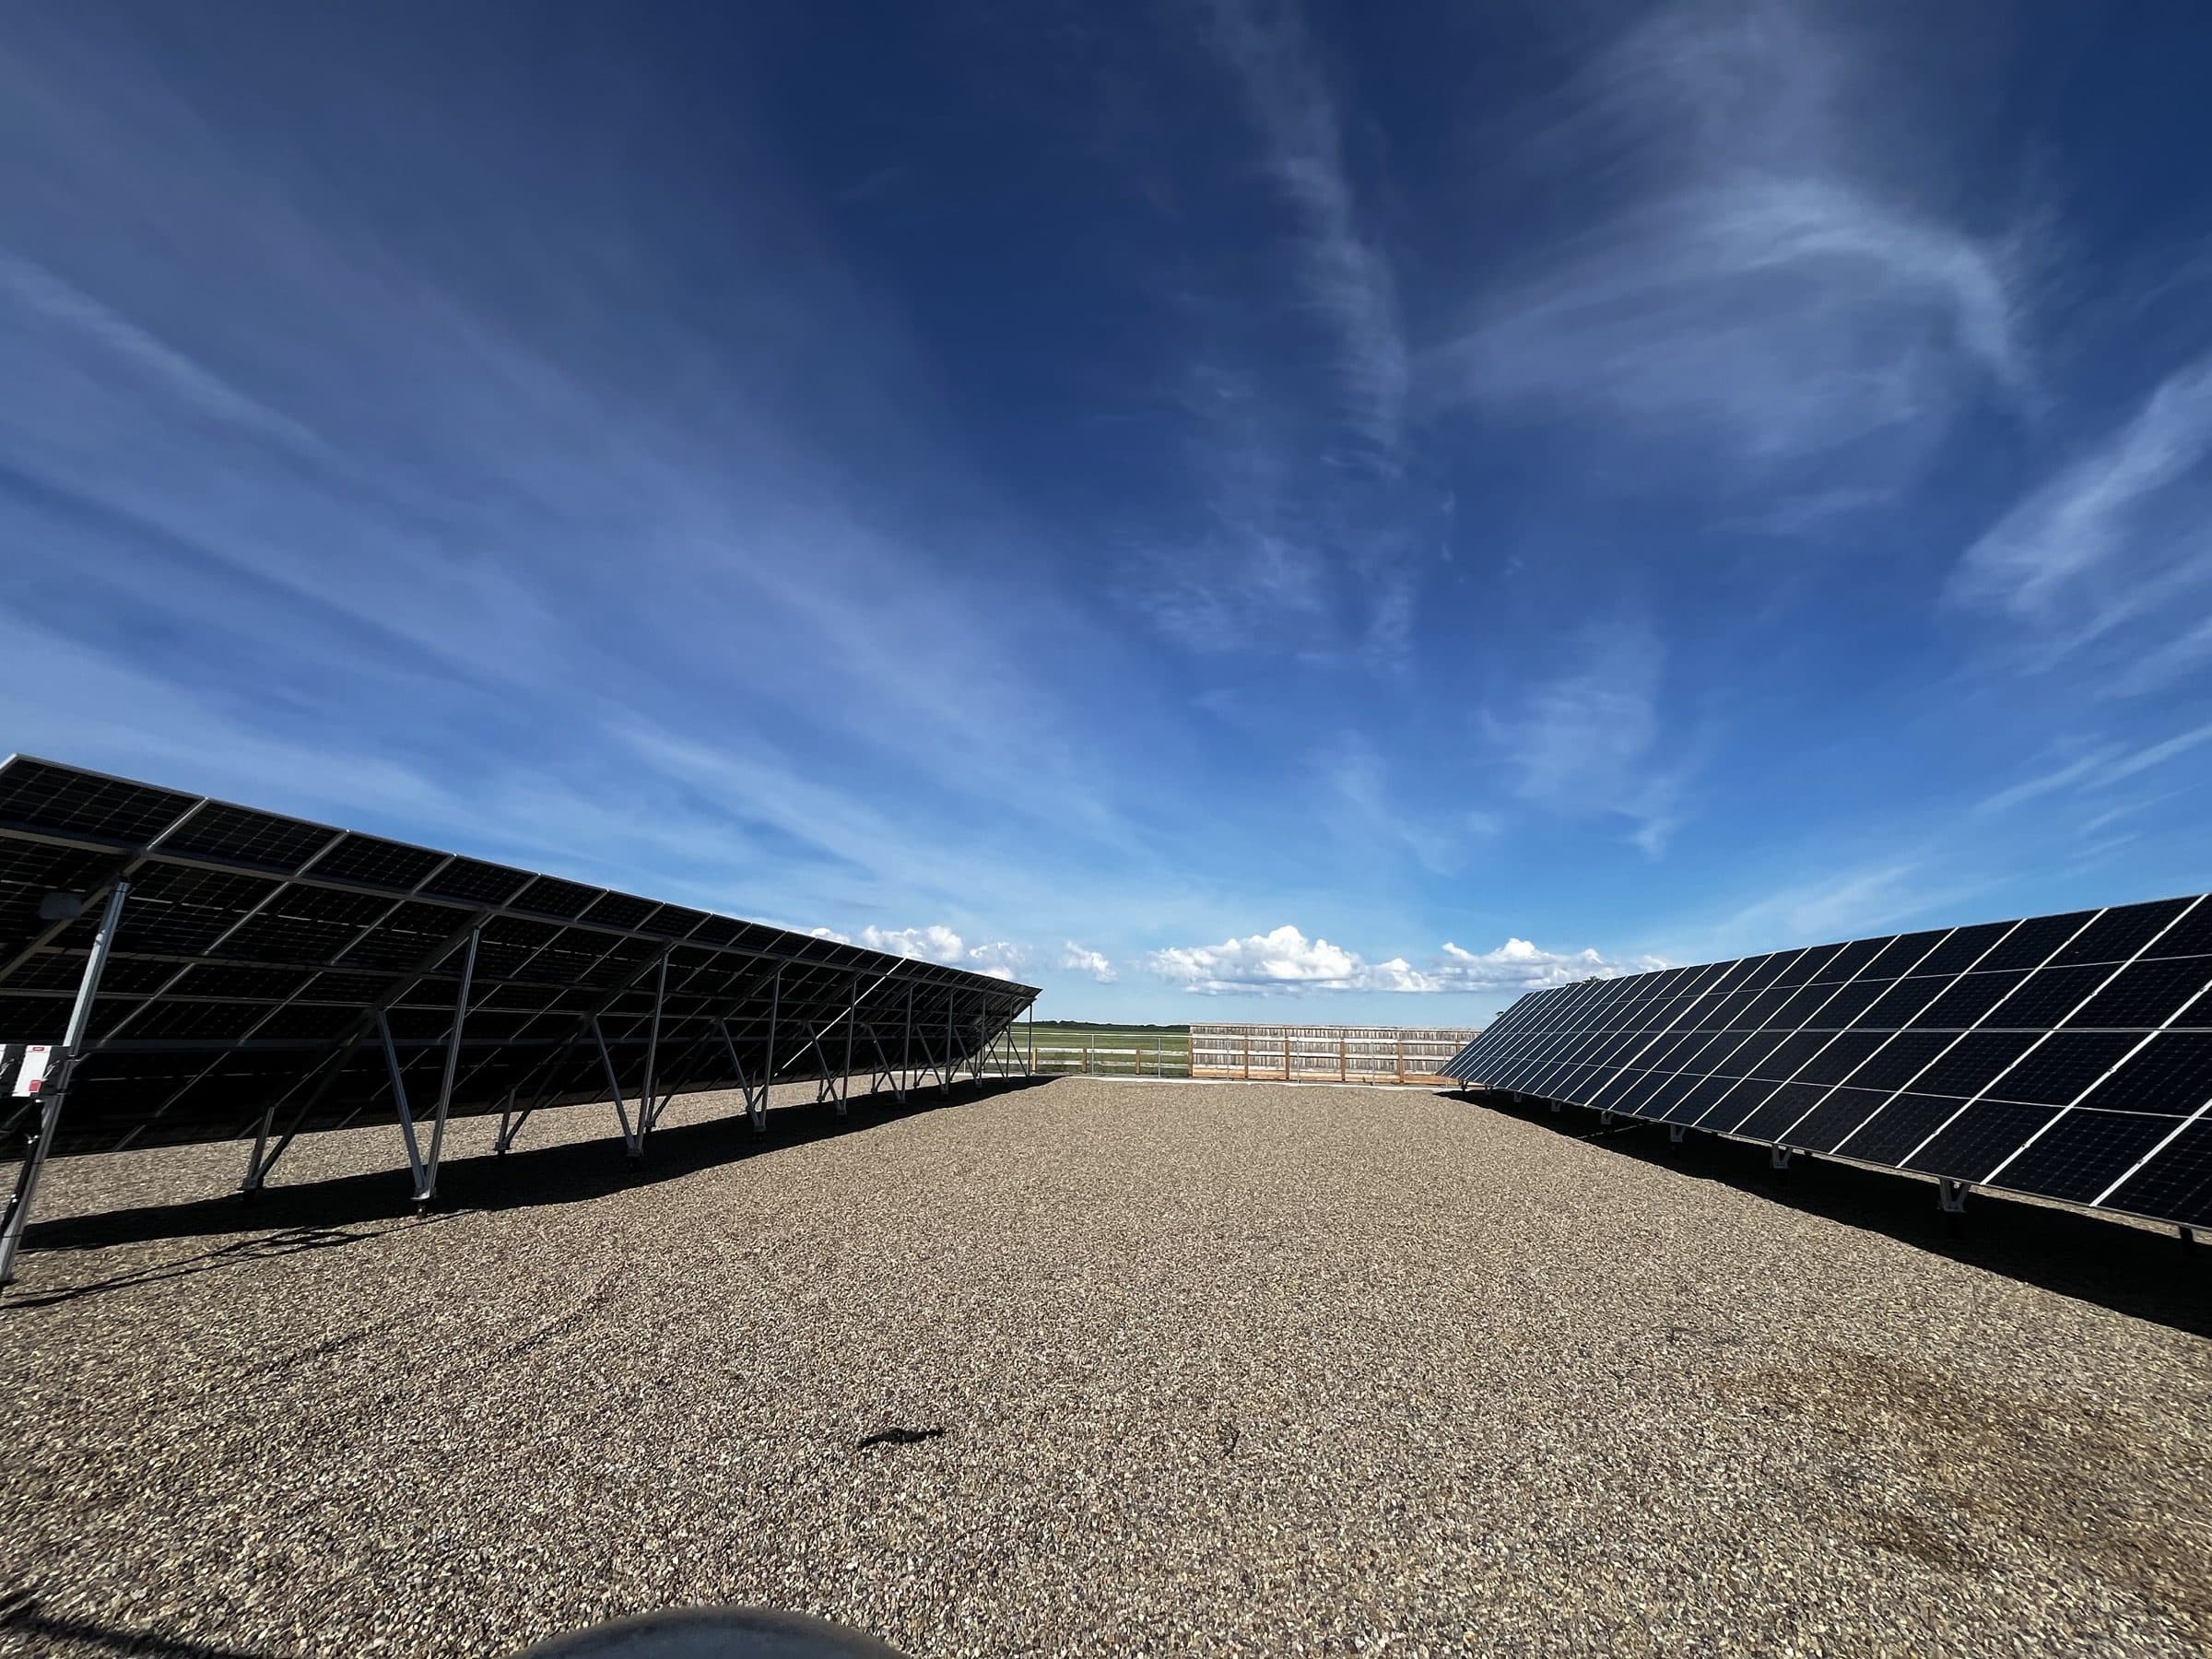
Wayne and Lynette Audette's 23.54 kW bifacial ground-mount solar system near Melfort produces 35,000+ kWh per year on a mixed grain and livestock farm.
Wayne & Lynette Audette · Installed June 2024
Project overview
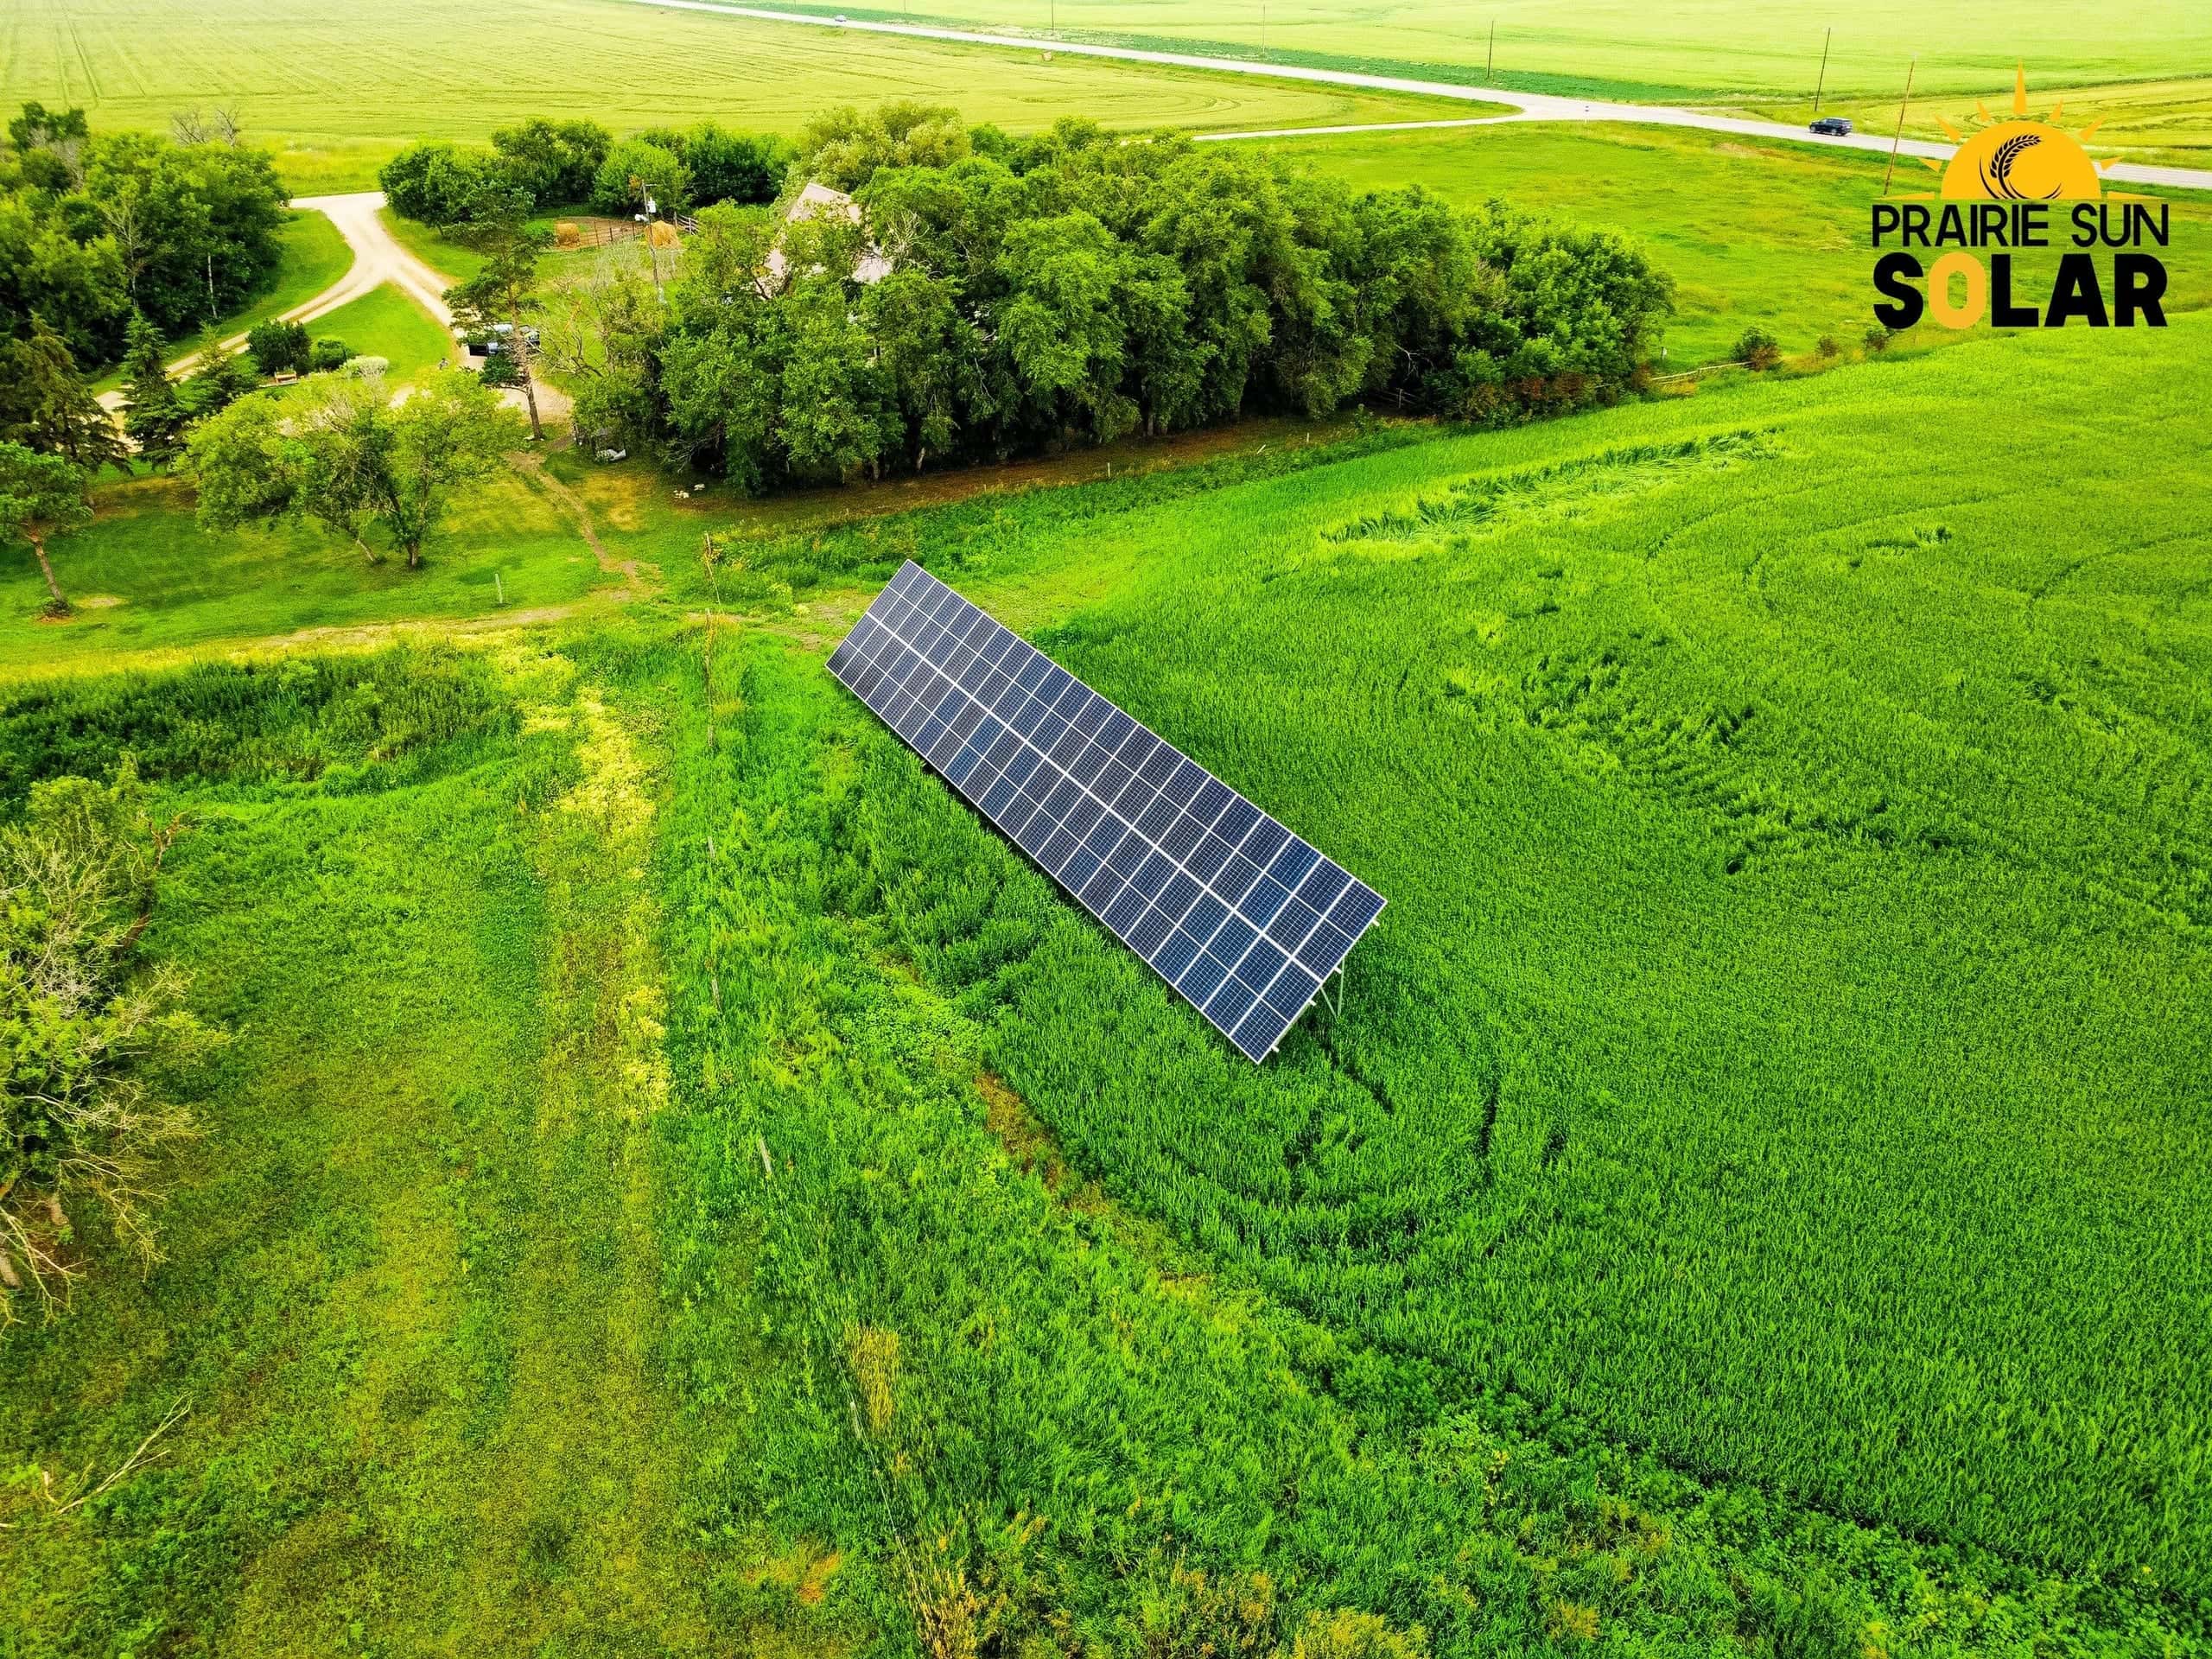
Wayne and Lynette Audette's 23.54 kW bifacial ground-mount solar system near Melfort, in north-central Saskatchewan, powers their mixed grain and livestock farm. Annualized output is roughly 1,554 kWh per kW per year — above the Saskatchewan provincial average of 1,200–1,300, even at this northern latitude where sun hours are lower than the southern part of the province. Bifacial Canadian Solar panels capture reflected light off snow and bare ground, adding extra winter production a typical south-facing rooftop can't match. Two-year production trend: 35,280 kWh in their first full year (2025), on track for similar in 2026.
What stands out
- Mixed grain and livestock farm solar near Melfort, Saskatchewan — 23.54 kW bifacial ground-mount system serving both sides of the operation
- 1,554 kWh per kW per year — above the Saskatchewan provincial average of 1,200–1,300, strong performance even in north-central SK where sun hours are lower than the south
- Bifacial Canadian Solar panels capture reflected light off snow and bare ground — extra winter production a typical south-facing rooftop can't match
- First full year (2025) hit 35,280 kWh — on track for similar in 2026
Live production data
Real numbers, real system
kWh lifetime
kWh per kW / year
DC capacity
Avg kWh / year
Production efficiency
kWh per kW of solar — per year
vs. Saskatchewan provincial average of roughly 1,200–1,300 kWh/kW/year
Wayne & Lynette Audette
kWh per kW per year
23.54 kW · bifacial — +24% vs SK average
What this means for you: kWh per kW per year is the gold-standard measure of solar performance — it accounts for system size, sun hours, panel orientation, and weather. Higher numbers mean fewer panels needed for the same energy output, lower install cost, smaller footprint on your roof or land, and a faster payback period.
Month-by-month production
kWh per calendar month
* Partial month (current month to date)
Powered by SolarEdge · live monitoring
More projects like this
view all →
Farm · Ground Mount
Mackenzie Family Farms Go Solar Near Estevan
Estevan area, SK
Farm · Ground Mount
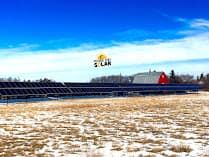
Tilson Farm Solar — 94,000 kWh per Year Near Moose Jaw
Moose Jaw area, SK
Farm · Ground Mount
Robertson Farm Solar — 83,000 kWh per Year + Battery Backup Near Swift Current
Herbert area, SK
Start your project
Ready to be our next project?
Get a free, no-obligation quote. We'll design a system tailored to your property, energy usage, and budget.
Get a free quote